
Of course drones are cool, I think we can all agree with that, but they can also be extremely helpful, especially when you apply them to solutions related to agriculture.
How can a drone help a farmer? The process is relatively straight forward. In the beginning of the growing season, a farmer is faced with a load of decisions about the upcoming few months, most of which support the main goal of maximizing the yield of the crops planted, while at the same time minimizing the investment you are making in both time and money (but I have heard it said that time IS money, so I guess the goal is to simply minimize money)! One of the ways drones help is by periodically flying over the fields to collect and process data. The collected data provides valuable insight and supports business decisions based on the analysis of the data.
What type of data are we talking about? This could simply be aerial imagery of the field, which on its own is quite useful, or it could be a much more advanced analysis using near-infrared analysis. Without going into too much of the science behind this approach, infrared light is reflected greater by healthier plants, so collecting data in that spectrum provides a good estimate of which plants are healthy versus which may not be doing so well.
This isn't a new process, in fact it has been used since the 1970's by satellites (Landsat) to produce vegetative index maps (NDVI - Normalized Difference Vegetation Index). Most of us don't own or have access to our own satellites, but drones can easily fly over an area and collect similar types of data!
The advantages of using a drone are numerous, and include the low associated cost, the speed at which results can be processed and the high resolution data that can be collected thanks to the ability of drones to fly/hover at low altitudes.
Here is an example of some collected data which shows NDVI results.

NDVI imagery of early season corn
Why would you want this type of data? Well, let's say you are a grower who just planted 100+ acres of corn. In some areas you planted one type of hybrid seed while in other areas you planted a different type. Each seed type grows differently and may require different levels of attention when it comes to applying things like nitrogen, pesticides, fertilizers, or other applications. So, you fly a drone in the beginning of the season just after planting to look for trends in the growth and possibly use the data to decide where and how much nitrogen to apply, for example. You can then repeat this process later in the season as the crops are maturing to reveal other problem areas which may need immediate attention. Pest problems or diseased crops are issues you want to put a quick end to!
I collected data for a local grower early on in his growing season, and once again later in the season, to use the data and identify the growing trends of two different seed types, recognize trouble areas, and extract other decision-making value that the data might provide. Here are some of the steps in the process:
PLAN THE COLLECTION
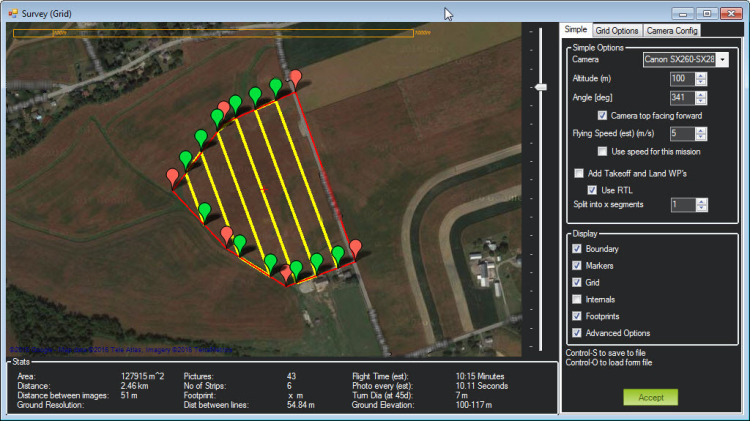
Getting the right plan is critical, luckily there are lots of planning tools available to help make sure the drone is flying at the right altitude, making the right number of passes, and other considerations to ensure a good data collection mission plan.
FLY THE MISSION
The fun really starts here when you put the camera and drone up in the air with it's carefully planned mission and watch it autonomously fly and collect the data for you! Keeping eyes on the drone and tracking it's flight with ground control software ensures that you can safely and effectively take back control if things aren't going as planned. I plan to talk in much greater detail about these precautions and some of the technology used during data collection in a later post, but this really is my favorite part of the whole process!

PROCESS THE DATA
After the data collection, it is time to process and deliver the results. Here you can see some of the results that were processed early in the season while the crops were only about 6-8 inches tall:

And here you can see the same area collected about a month later when the crops were well over 6 feet tall:

The brighter green colors indicate very healthy crops while the red colors are indicative of poor health.
You can certainly see just from this data comparison that early on in the season there are already some noticeable areas of dark red which show up even later in the season as the more unhealthy areas. This information could be used to target and prescribe fertilizers, pesticides, or nitrogen treatments to these areas.
This is just one way drones are helping bring decisionable data to agriculture professionals!